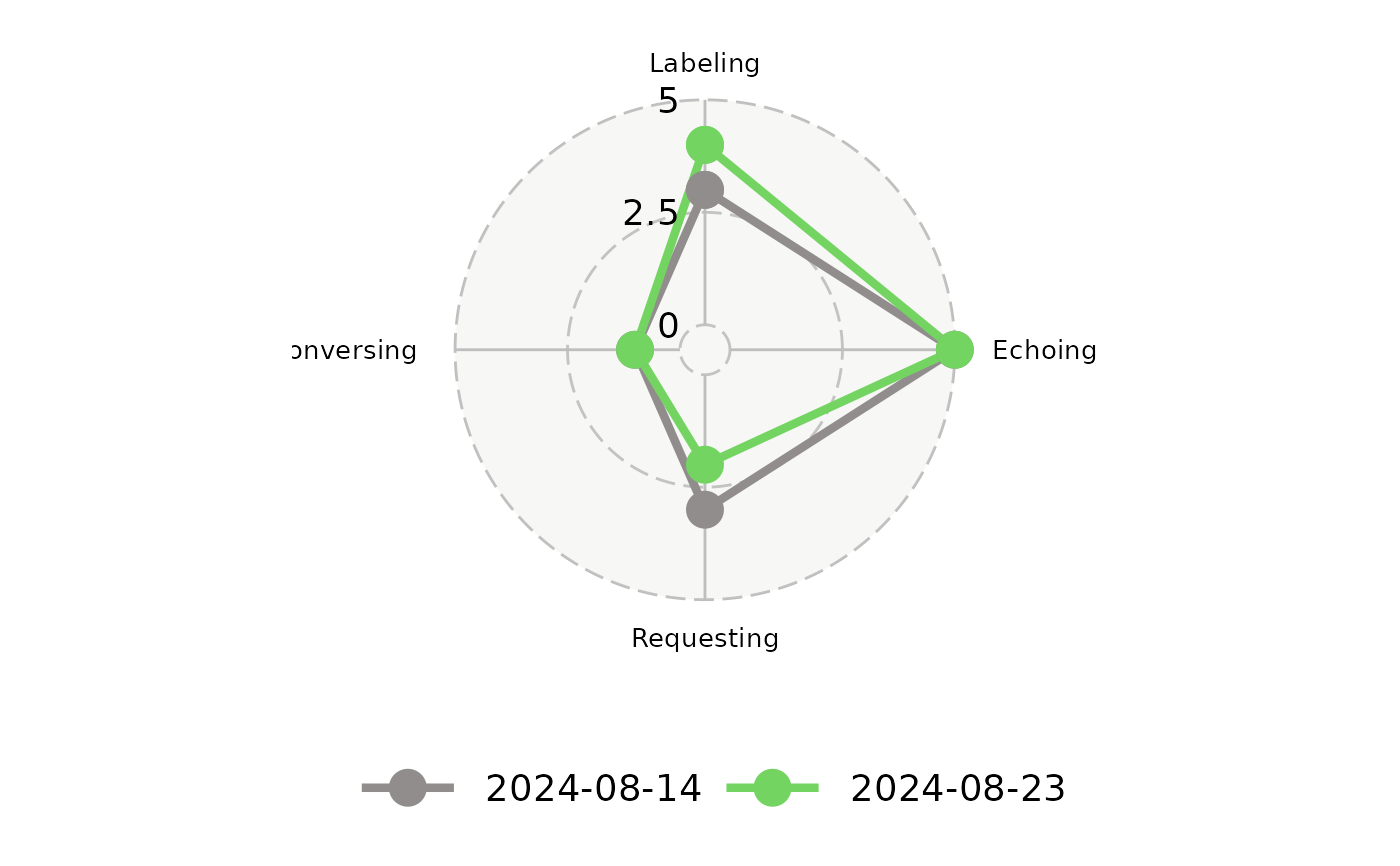
Area Q Plot
plot_area_q.RdThis function generates an Area Q plot to visualize response types (e.g., Conversing, Labeling, Echoing, Requesting) for VOX Analysis. The plot can display data for a single evaluation (e.g., a play therapy session) or compare multiple evaluations over time to reveal changes in language development patterns. This flexibility allows users to analyze individual sessions or observe trends across multiple sessions.
Arguments
- df_summarized_response
A `data.frame` summarizing each verbal operant (Conversing, Labeling, Echoing, Requesting) for a given evaluation date. This summary provides a condensed view of responses and can be produced using the `util_summarize_response` function.
- date_primary
A single date `vector` specifying the primary evaluation date. This parameter is essential when multiple evaluation dates are available, as it determines which date will be prioritized for calculations or highlights within the function.
- ind_doc_version
Logical (`TRUE` or `FALSE`): Indicates whether a plot needs to be optimized for inclusion in a Word document. If `TRUE`, font sizes and other aesthetics will be adjusted to enhance Word document readability.
Examples
# Load example data
data("df_summarized_response_example")

# Generate an Area Q plot for selected dates
plot_area_q(
  df_summarized_response = df_summarized_response_example[1:2, ],
  date_primary = "2024-08-23"
)